Critical mass
Published 11:41 am Friday, October 4, 2013
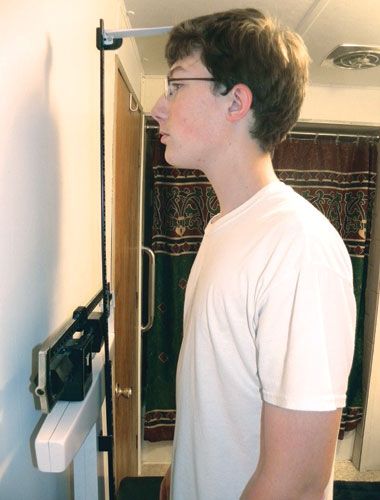
- Body Mass Index is the measurement of a persons weight in relation to his height. Though BMIs do not reveal the percentage of fat in the body, Dr. Nancy Findholt of OHSUs School of Nursing at EOU believes its still the best indicator of obesity in children and teens. (Trish Yerges photo)
Collaborative project measures body mass index of Union, Wallowa county students
Oregon Health and Science University’s nursing faculty and students at Eastern Oregon University are calculating body mass indexes of students in grades K-8 in schools in Union and Wallowa counties as part of the SNACZ research study.
“SNACZ is designed to improve children’s snacking choices,” Findholt said, “and that’s ultimately what we hope to accomplish. Because the long-term goal of all of our studies is eventually to address weight in children, we decided we should be measuring that as well.”
This is done by calculating each student’s body mass index and plotting it on a growth chart according to age and gender. The students remain anonymous. The plotted data becomes a percentile ranking and these will fall into three primary categories of interest: underweight, overweight and obese.
“Body mass is a number calculated from a child’s weight and height,” Findholt said. “It is an inexpensive and easy method of screening to identify weight problems that could lead to other health conditions, such as high blood pressure or diabetes.”
The process of calculating BMI values for children (age 2 through 19) differs from that of adults (age 20 and older).
“With an adult you just have a BMI number,” Findholt said, “but with children, once it’s calculated, the number needs to be plotted on a growth chart. This gives you a percentile ranking which basically means that it tells you where the child’s BMI ranks in relation to other children of their same age and same gender.”
Since body mass refers to the body’s “thinness or thickness” in proportion to height, a growing child’s BMI will naturally fluctuate throughout the school year.
“Unlike with adults, age and gender have to be considered when you are interpreting BMI for children and teens,” Findholt said. “That’s because kids go through growth spurts, and these growth spurts tend to happen at somewhat different times for boys than for girls. So we have a growth chart for girls and one for boys, and then we figure out where the child’s age is on the chart and what their height and weight is to see if they are normal for children.”
BMI values are not intended to measure the exact percentage of fat in a body nor do these calculations factor in things like skeletal frame size, muscularity or essential fatty tissue in teen girls going through puberty.
That being the case, Findholt said that the BMI still remains one of the best indicators of obesity in children.
“It is considered quite reliable in children and teens,” she said. “Again, in a teen, he may be really muscular because he’s an athlete and that might provide a false reading, in a sense, but basically it is a good estimate. What BMI doesn’t tell you, and that’s where some of the confusion sets in, is that it doesn’t really say the child is at risk for disease.”
Findholt noted that some people can have a higher BMI and still have a good, strong heartand not have diabetes. Conversely, somebody can have normal BMI and still have those problems.
“Although a child may have a high BMI for their age and gender, a healthcare provider would need to conduct other assessments to determine whether the child already has or is at risk for health problems related to weight,” Findholt said.
The OHSU research team began taking students’ BMI measurements in the fall of 2012 and again in the spring of 2013 to establish baseline figures for the next three years of measurements.
In Union County, measurements taken in the fall of 2012 showed that 30.8 percent of the students were overweight and 15.7 percent of the students were obese. In Wallowa County, 27.9 percent of the students were overweight and 12.5 percent were obese.
In the spring of 2013, the BMI measurements in Union County showed that 33 percent of the students were overweight and 16.3 percent were obese. In Wallowa County, 29.5 percent of the students were overweight and 13.3 percent were obese.
“The study suggests that in the fall when we measured these students, they just came from summer activity. This suggests that they are not as active during the school year,” Findholt said. “The schools are doing a pretty good job of providing healthy meals, so this data is suggesting that their weight in proportion to their height increases by spring, and they are more likely to be overweight or obese by spring.”
The data from the OHSU study shows that Union County is very similar to the national data, and Wallowa is a little under the national average.
“But having almost one third of school children in our region being overweight or obese is really something people should be concerned about, and we should be taking some actions to address this,” Findholt said.
She suggested that schools will need to find ways to create more physical activities in school.
“It’s hard because in our smaller school districts, there isn’t enough gym space because the gym is often used as a cafeteria,” Findholt said. “But there are other ways to do this, like exercise breaks right in the classroom or a more structured recess where all the kids are involved chasing the ball around instead of sitting and talking to their friends.”


